Teaching guide: mean, median, mode and measures of spread
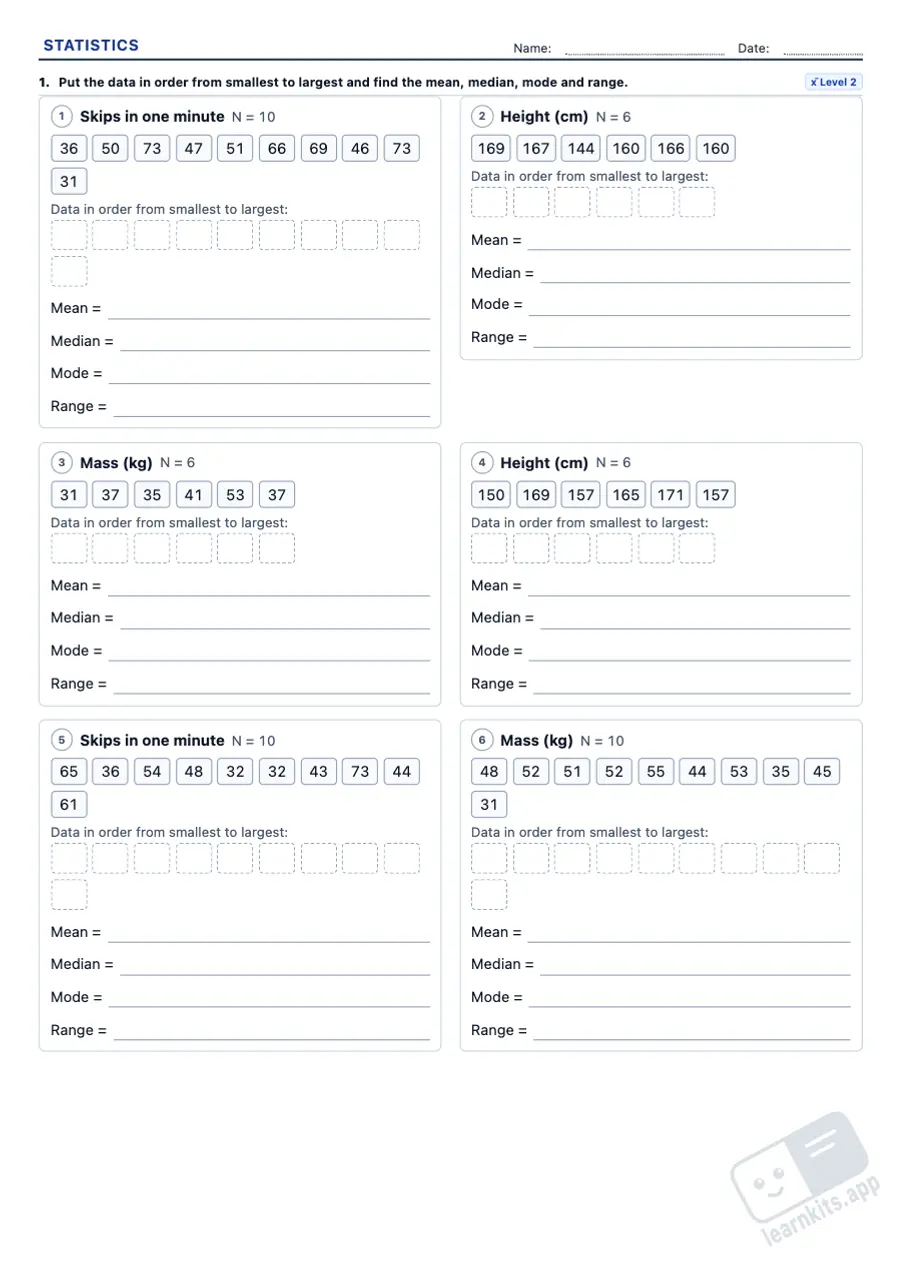
Averages and measures of spread sum up a set of data in a few numbers: where its centre is (mean, median and mode) and how spread out it is (range, quartiles, standard deviation). In Grades 5 and 6 pupils find the mean, median, mode and range of short lists; in Grades 7 to 10 they add frequency tables, quartiles, box plots, standard deviation and grouped data. This free generator makes A4 worksheets with new data every time and an answer key that shows the working behind each answer.
Student worksheet
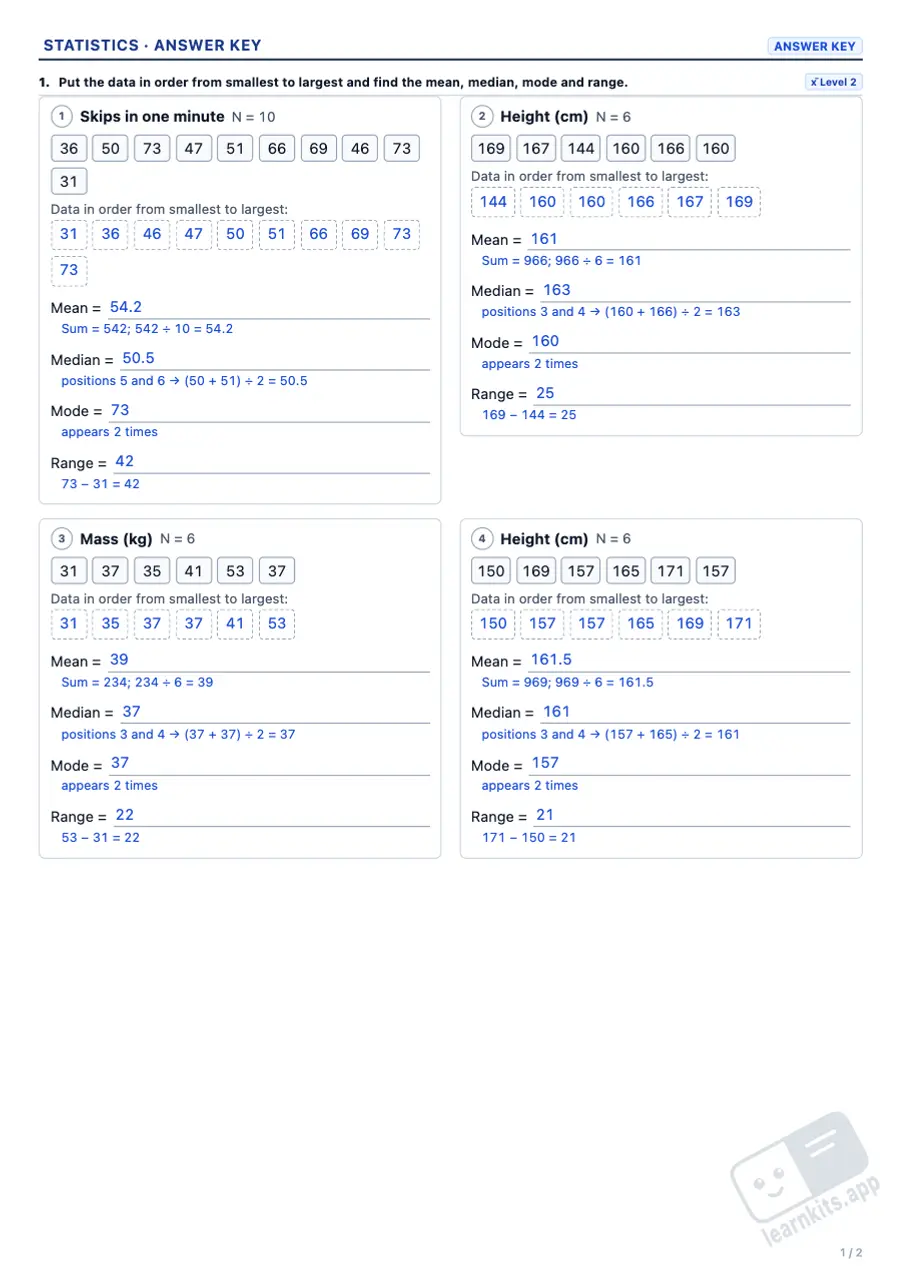
Answer key
Sample made with LearnKits. Every worksheet is new: choose the topic, level and amount and print it for free.
x̄ Mean, median and mode
Lists of 5 to 12 values to put in order: the mean (total ÷ number of values), the median (the middle value or the mean of the two middle ones), the mode and the range.
f Frequency tables
Frequency, relative frequency, cumulative frequency and percentages, and the mean, median and mode worked out from the table.
Q Quartiles
Q₁, the median and Q₃ with the position method k × N/4, printed on the sheet so that the whole class uses the same rule.
Box plots
Read the five-number summary from a box plot, draw one from a list and compare two groups on the same axis.
σ Standard deviation
The table of deviations, the formula with x² × f and the coefficient of variation to decide which group is more consistent.
Grouped data
Sorting data into classes, midpoints, modal class and the class containing the median, estimated mean and standard deviation.
Frequently asked questions about mean, median and mode worksheets
How do you find the mean, median and mode?
The mean is the total of all the values divided by how many values there are. The median is the middle value when the data are in order (with an even number of values, the mean of the two middle ones). The mode is the value that appears most often. For example, with 2, 3, 3, 5 and 7: mean 20 ÷ 5 = 4, median 3 and mode 3.
What if no value repeats, or two values repeat equally?
If every value appears only once, there is no mode. If two values appear the same number of times and more often than the rest, the data are bimodal and have two modes. Level 3 of the lists includes both cases on purpose.
What is the range?
The difference between the largest and the smallest value: it shows how spread out the data are. With temperatures below zero, subtract the negative number: 8.5 − (−2.0) = 10.5.
Which method is used for the quartiles?
The position method: work out k × N/4 for Q₁ (k = 1), the median (k = 2) and Q₃ (k = 3). If it is a whole number, the quartile is the mean of the value in that position and the next one; if not, it is the value in the next position up. Textbooks use slightly different rules, so the method is printed on the sheet.
How do you draw a box plot?
Find the five-number summary (minimum, Q₁, median, Q₃ and maximum), draw a box from Q₁ to Q₃ with a line at the median, and whiskers out to the minimum and maximum. The box holds the middle half of the data.
How do you work out the standard deviation?
The variance is the mean of the squared deviations from the mean, σ² = Σ(x − x̄)² ÷ N, or σ² = Σx²f ÷ N − x̄² from a table. The standard deviation is its square root, which the answer key rounds to 2 decimal places.
How is this different from the statistical charts worksheets?
The statistical charts worksheets are about pictograms, bar charts, line graphs and pie charts, and tallying data into a table; these focus on the measures: mean, median, mode, quartiles and spread. They go well with reading graphs and the PISA-style maths problems.
Which grades are these worksheets for?
Mean, median, mode and range of lists are for Grades 5 and 6; frequency tables for Grades 7 and 8; quartiles, box plots, standard deviation and grouped data for Grades 9 and 10. Find more resources under maths worksheets.
How do I print only the answer key?
Click Print and choose "Answer key", or "Worksheet and answer key" for both. Your browser's print dialog can also save it as a PDF. Worksheets are generated in your browser and no data is sent anywhere.
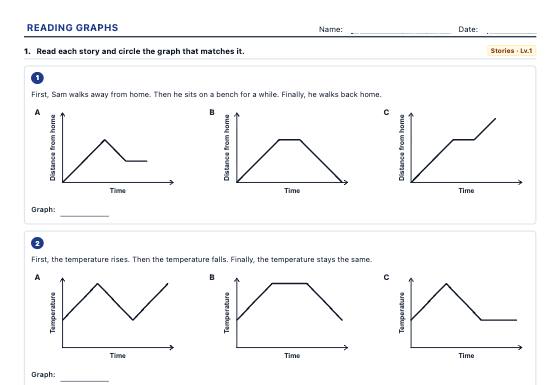
Everyday graphs to match to a story, read values and rates of change, describe trends, compare two series and spot misleading graphs, with an answer key.
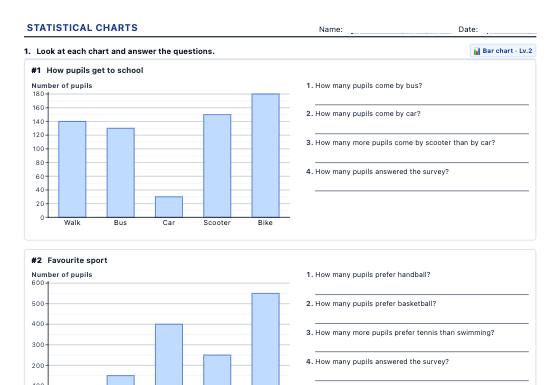
Pictograms, bar charts, line graphs and pie charts to read and to draw, and frequency tables with mode, mean and median, with new data every time and an answer key.
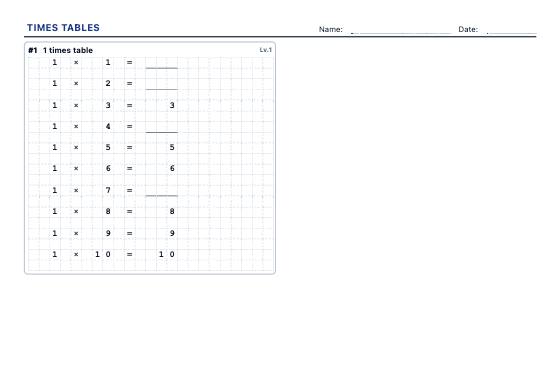
A4 worksheets for the tables you choose: complete the table, shuffled facts, missing factors, multiplication grids and division facts, in three levels with an answer key.
This feature is not yet available. We are actively building advanced tools for schools, tutoring centers, and teachers.
Notice: All current worksheet generators and printable materials on LearnKits are and will remain 100% free and open. Pro will be an optional enhancement for school institutions.
Features in development:
No Watermark: Print worksheets and answer keys without the LearnKits mark.
Cloud Collections: Access and organize your worksheets from anywhere.
School Branding: Add your school crest and custom header notes.
Direct PDF Export: One-click vector PDF downloads without print popups.
Thank you! We will notify you first as soon as LearnKits Pro becomes available.
Analytics and advertising cookies
We use Google Analytics to learn which resources are used and improve them, and Google AdSense to show ads that keep LearnKits free. If you accept, ads may be personalised; if you reject, they are non-personalised. You can change your choice at any time from the page footer. Cookie policy
 Student worksheet
  Answer key