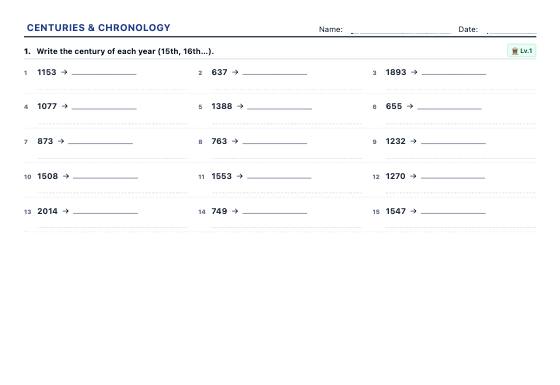
Centuries & Chronology
Unlimited exercises to turn years into centuries, place dates BC and AD, work out elapsed years and put events in order, with an answer key.
Printable history and geography worksheets with an answer key: centuries and timelines, latitude and longitude, countries and capitals, population pyramids and climate graphs with real data.
Unlimited exercises to turn years into centuries, place dates BC and AD, work out elapsed years and put events in order, with an answer key.
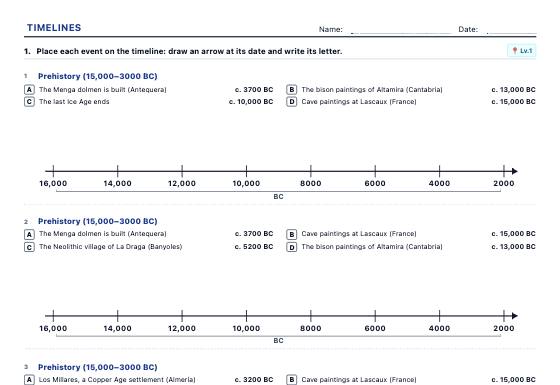
Timelines drawn to scale to place and order events from Prehistory to today, work out elapsed time and draw a timeline of your own life or family, with an answer key.
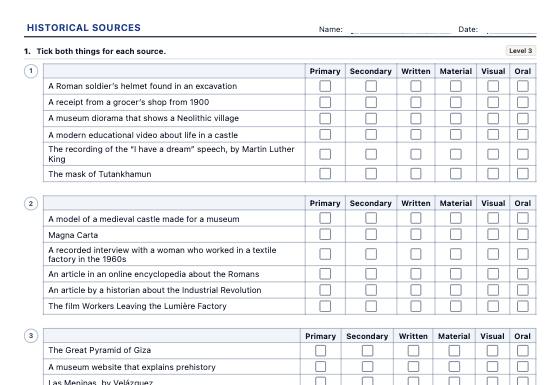
Worksheets for working with historical sources: primary or secondary, written, material, visual or oral, the card of a real source (author, date, place, purpose), dating and ordering sources, fact and opinion and comparing two sources on one event, in three levels with an answer key.
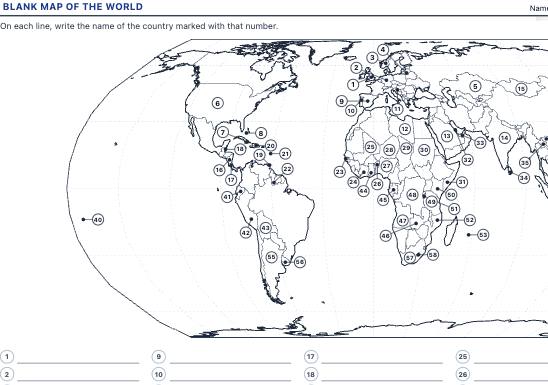
A4 blank maps to locate countries, capitals and continents, plus the rivers and relief of Spain, with numbered markers to label and an answer key with every name filled in.
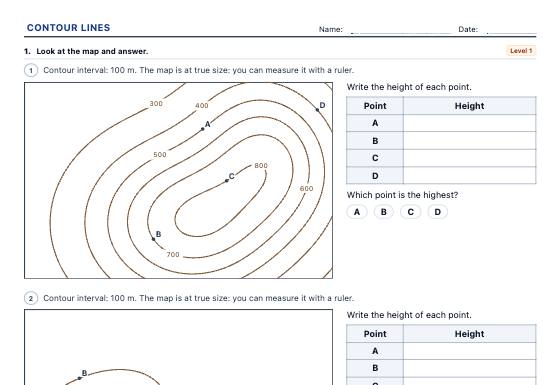
Random topographic maps printed at true size: heights of points on and between contour lines, comparing steepness, drawing the cross-section along a line and working out distances, height differences and gradients with the scale, in three levels with an answer key.
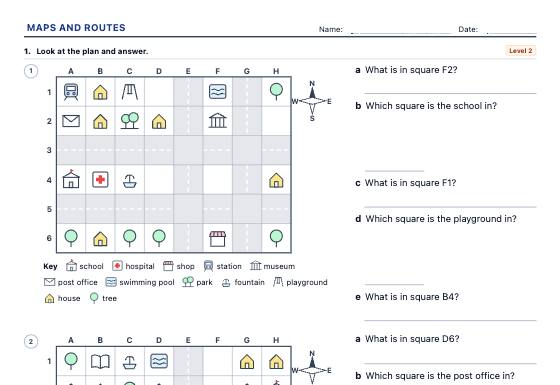
Map skills worksheets on random town plans with our own symbols: compass directions, grid references (B3), following and writing routes, left and right from someone else's point of view and the key, in three levels with an answer key.
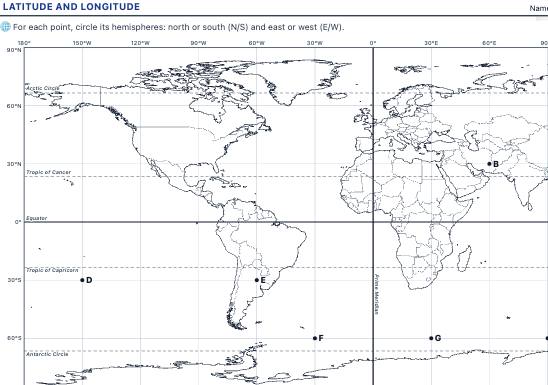
A world map with parallels and meridians to read and plot coordinates, identify hemispheres and find continents, oceans and cities from their latitude and longitude, with an answer key.
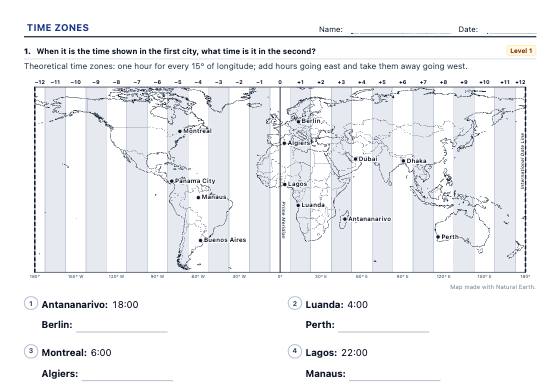
Time zones on a time zone map: a city's zone from its longitude, the time difference, what time it is in another city, a flight's local arrival time and the hours two offices share, with official time, half-hour zones and the International Date Line at level 3 and a worked answer key.
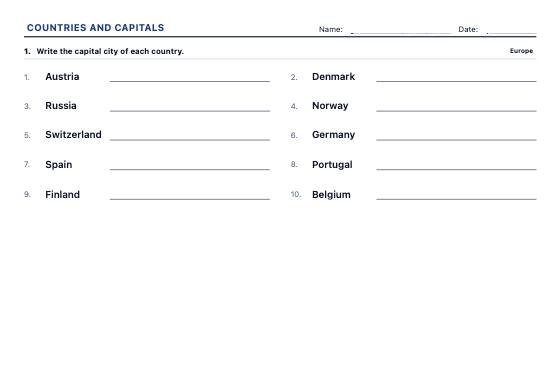
Worksheets to write the capital or the country, match them with arrows and choose the right answer, continent by continent and at three levels, from the best-known countries to every UN member.
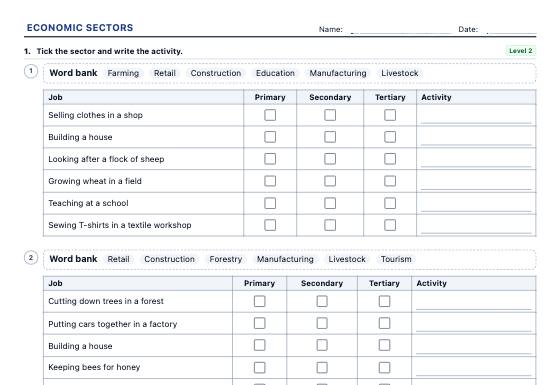
Economic sectors worksheets: sort jobs and workplaces into the primary, secondary and tertiary sectors, the chain of a product, real employment data by sector for 38 countries (World Bank, 1991 and 2022), globalisation and the balance of trade, in three levels with an answer key.
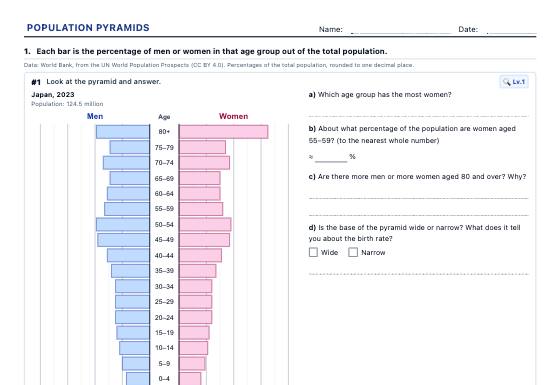
Population pyramids with real data from 40 countries (1960-2023) to read and classify, draw from a table, work out demographic indicators and compare, with an answer key.
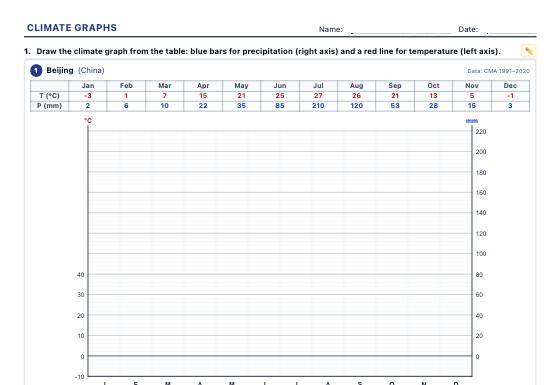
Climate graphs with real weather station data to draw, analyse (temperature range, mean temperature, dry months) and identify the climates of the world and of Spain, with an answer key.
History asks children to place events in time; geography asks them to place people and places on the Earth. Both need tools that take practice: counting centuries and years BC, drawing a timeline to scale, reading coordinates, interpreting a graph made from real data. These kits turn those skills into short, clear exercises. Timelines are drawn to scale, maps come from Natural Earth data, population pyramids and climate graphs use real figures, and every answer in the key is worked out from what is printed on the sheet. Print them for class or save them as a PDF to share.
Turning 1492 into the 15th century confuses many children. Centuries and chronology worksheets give unlimited practice with years, centuries, BC and AD and elapsed time. Timeline worksheets then place real events from Prehistory to today on a line drawn to scale, or a pupil’s own life and family.
Read and plot points on a world map with parallels and meridians using latitude and longitude worksheets. Learn countries and capitals continent by continent, from the best-known countries to every UN member, writing, matching and choosing the right answer.
Older students read and classify population pyramids from 40 countries between 1960 and 2023 and work out demographic indicators. With climate graph worksheets built from real weather stations, they find the temperature range and dry months and identify climates of the world.
Use a short timeline exercise to open a new period, and come back to it at the end to add what was learnt. A blank map of a continent makes a quick review before a test, and two climate graphs side by side spark a good discussion about why places differ.