Reading Graphs
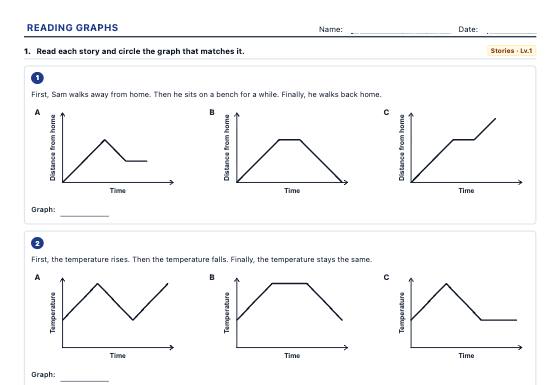
Everyday graphs to match to a story, read values and rates of change, describe trends, compare two series and spot misleading graphs, with an answer key.
Competency units like the ones in PISA and national tests: a real-life situation, several questions of rising difficulty and marking with full, partial or no credit. Free, new every time, from Grade 4.
PISA is the OECD’s international study of whether 15-year-olds can use what they have learnt in real-life situations. It does not ask for definitions: it sets problems. Many national and regional competency tests follow the same format.
Formulating a situation mathematically, employing concepts and procedures and interpreting the result in context: quantity, uncertainty and data, change and relationships, space and shape.
Locating information, understanding it, evaluating and reflecting on it in continuous texts, tables, charts, forms and several sources that disagree.
Explaining phenomena scientifically, designing and evaluating an enquiry and interpreting data and evidence to draw conclusions.
Unit prices, offers, budgets, tariffs, payslips and interest: making good decisions with money.
The PISA 2025 Foreign Language Assessment measures English reading and listening by CEFR levels.
Every competency test is built from the same piece: the unit. Our simulators make it with original content.
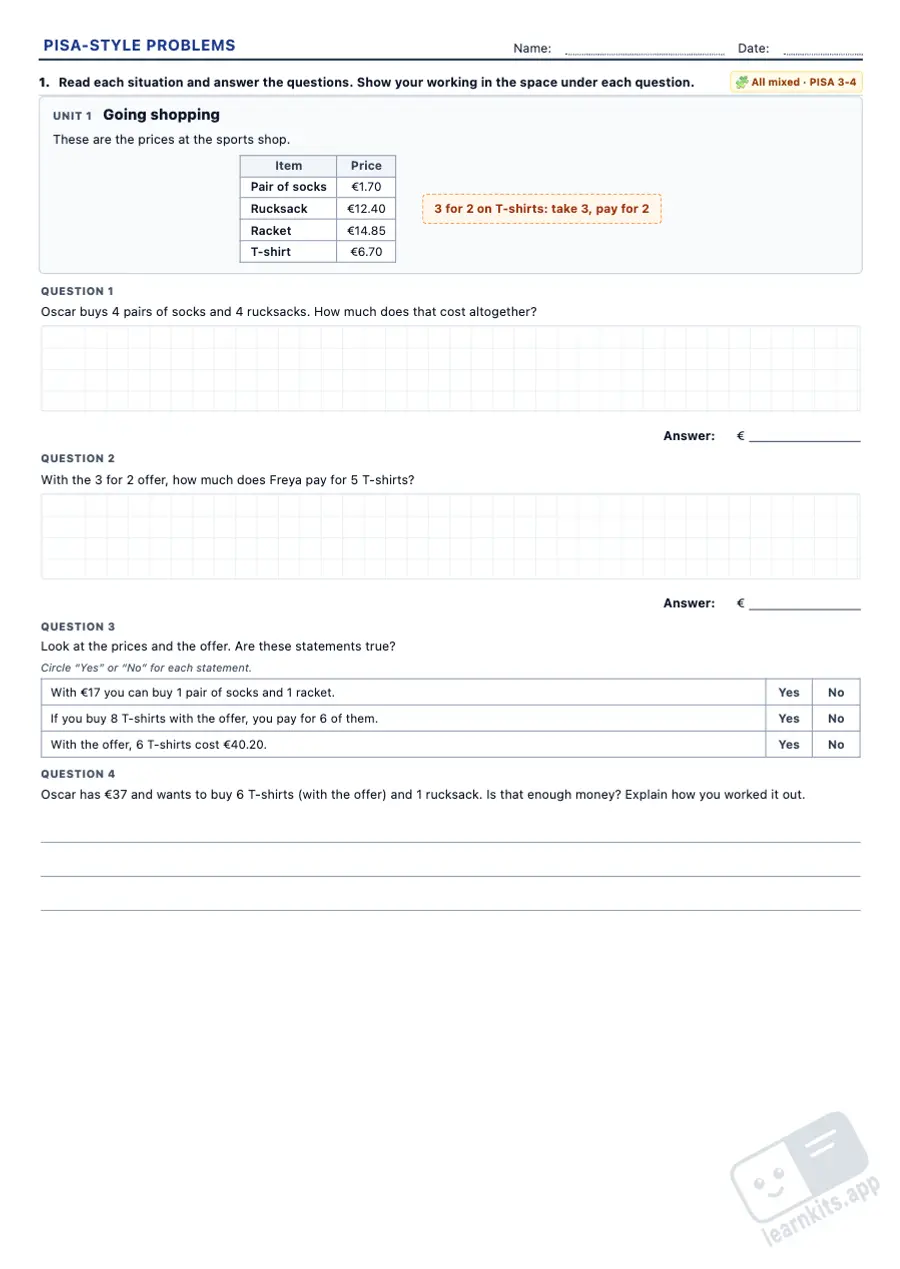
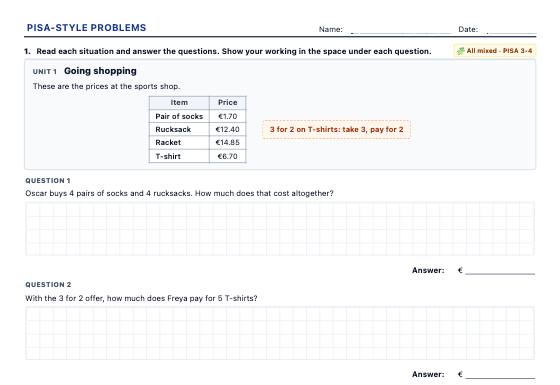
A real situation: a floor plan, a price list, a chart, an experiment or several texts on one topic.
Three or four questions, from finding a fact to arguing a conclusion, in mixed formats: multiple choice, yes/no, short and open answers.
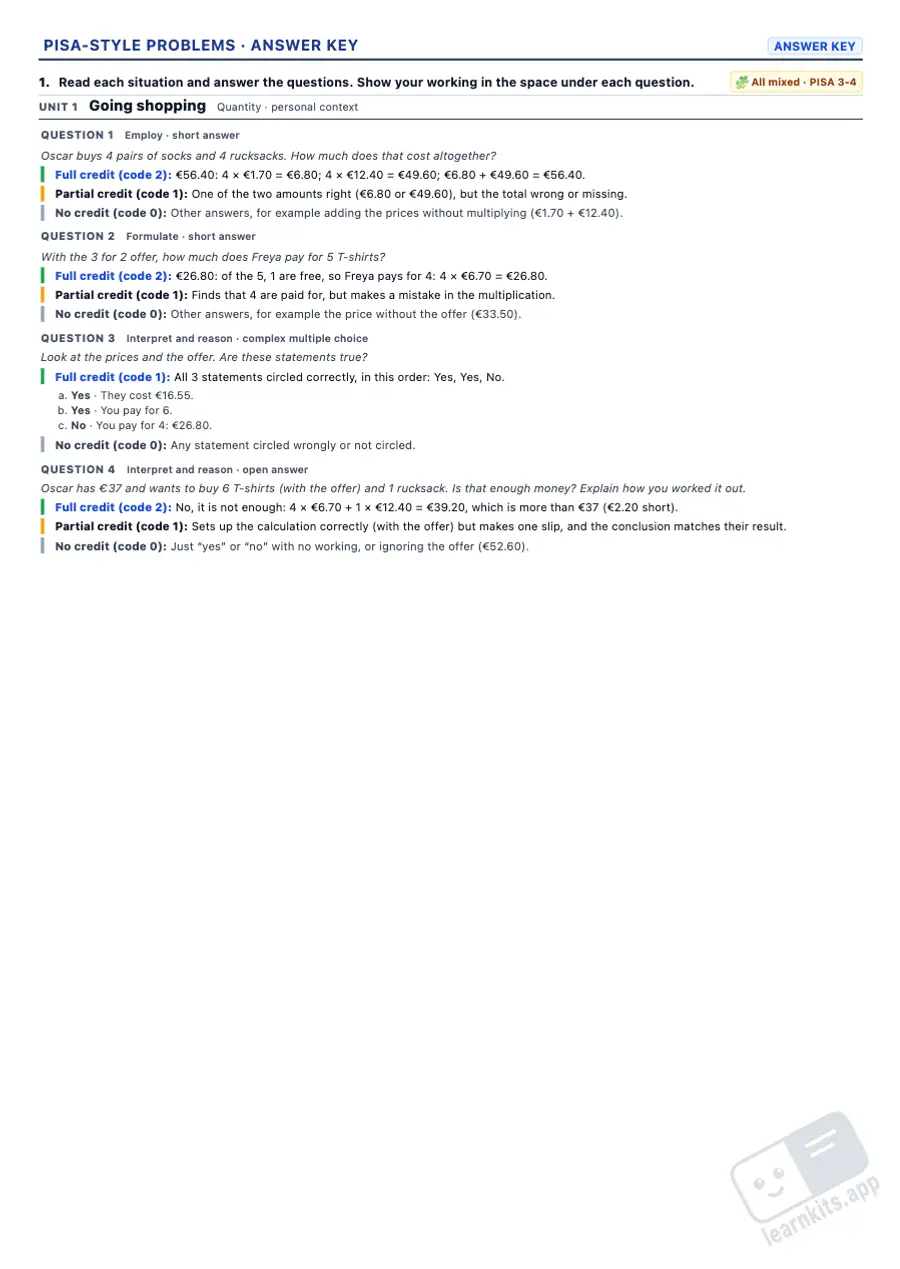
Full, partial or no credit, with the model answer and what is accepted. You mark it the way the test does.
They make whole units in the test format: a stimulus, questions of rising difficulty in mixed formats and how to mark them. They are meant to be sat as on test day, timed and without help.
Grade 4 – Grade 10
Units of three or four questions on prices, recipes, timetables, charts, chance, tariffs, maps and floor plans, with a marking guide of full, partial and no credit.
Open the simulator →Grade 1 – Grade 10
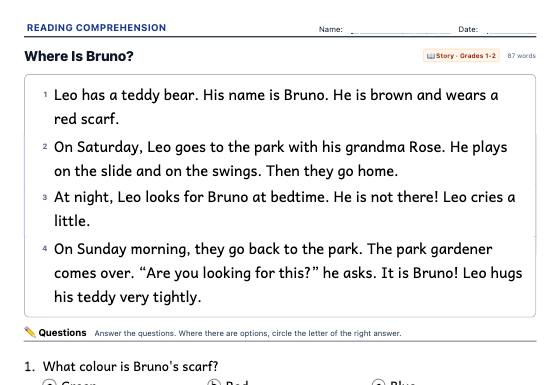
One original reading per sheet with literal, inference and evaluation questions. At the higher levels, the PISA formats: multiple sources, non-continuous texts and opinion texts.
Open the simulator →Grade 5 – Grade 10
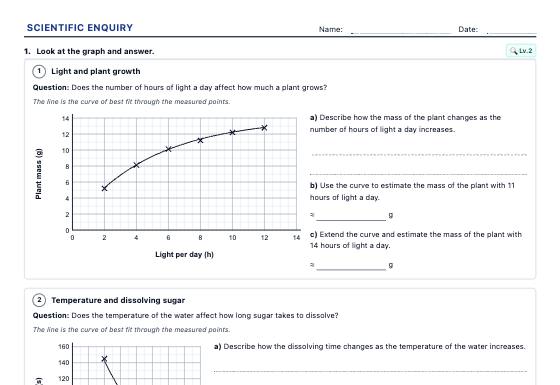
An experiment with its data and linked questions: variables, hypothesis, fair test, graph, conclusions and anomalous results, with a reasoned answer key.
Open the simulator →Grade 3 – Grade 10
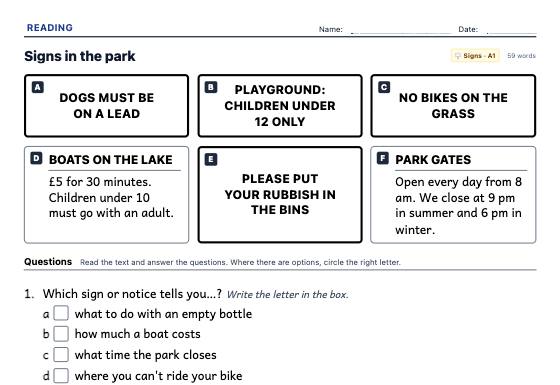
Signs, messages, adverts, articles and stories in English graded by CEFR (Pre-A1 to B1), with Cambridge- and PISA-style questions.
Open the simulator →Coming soon: full mock tests by subject and grade, with a cover, instructions, timing and a marking guide.
Every week or two, and before the test.
Between mock units, to reinforce.
Each one practises a skill the tests ask for: reading a chart, working out a percentage, using a scale, interpreting real data or arguing in writing. They reinforce whatever the simulator showed is hard.
Charts, money, proportion, percentages, scales and measurement.
Everyday graphs to match to a story, read values and rates of change, describe trends, compare two series and spot misleading graphs, with an answer key.
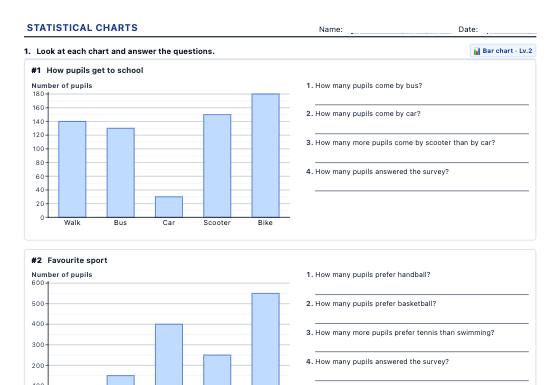
Pictograms, bar charts, line graphs and pie charts to read and to draw, and frequency tables with mode, mean and median, with new data every time and an answer key.
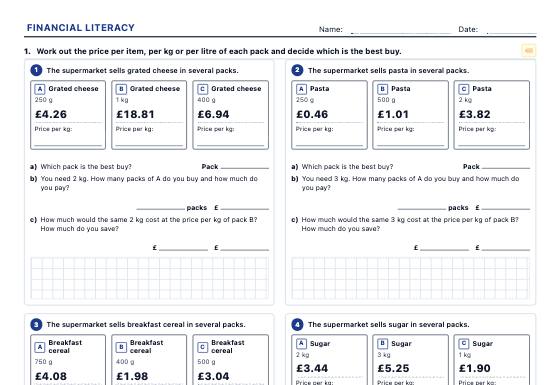
Shelf labels, invoices, receipts, budgets, payslips and bank statements to practise unit price, discounts, VAT, tariffs, simple and compound interest and loans, with a step-by-step answer key.
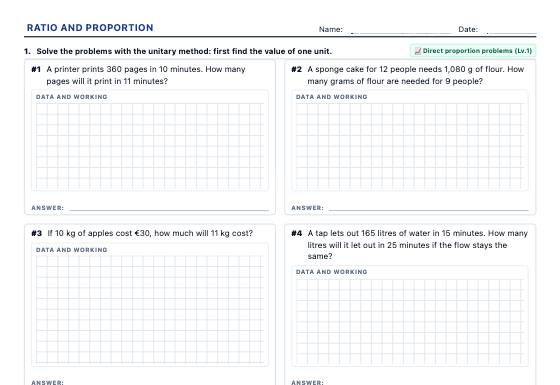
Proportion tables, direct and inverse proportion, compound proportion and sharing in a ratio, with real-life word problems and a step-by-step answer key.
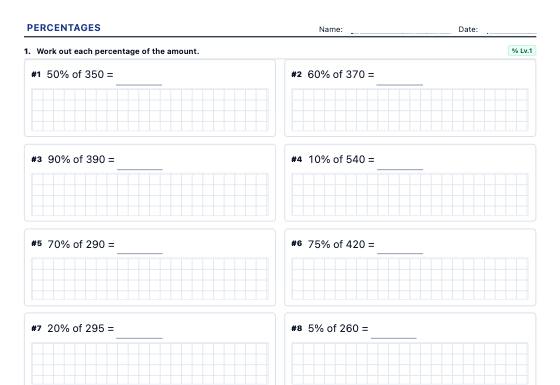
Percentage of an amount, one amount as a percentage of another, increases and decreases with the multiplier, successive and reverse percentages, percentages, fractions and decimals and word problems, with a step-by-step answer key.
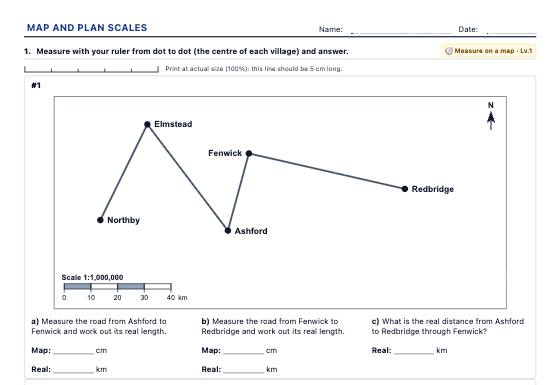
Ratio scale and scale bar worksheets: real and map distances, finding the scale, and village maps and floor plans printed at true size to measure with a ruler.
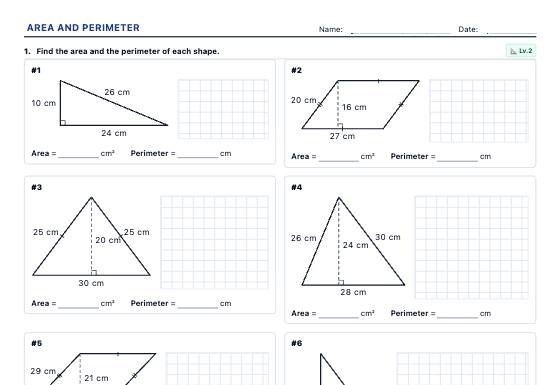
Area and perimeter worksheets with shapes drawn to scale: squared grids, polygons, circles, composite shapes, estimating irregular areas on a map and missing sides, with a step-by-step answer key.
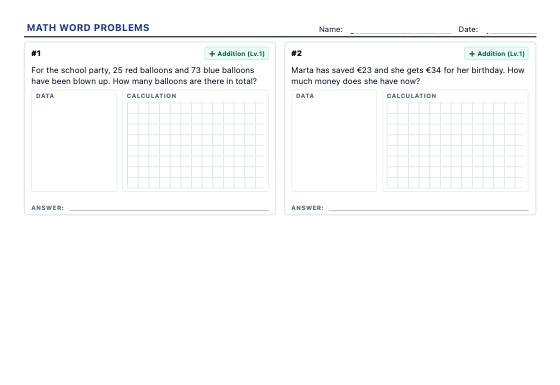
Printable real-world math word problems with dedicated sections for given data, workspace calculation grid, and sentence answer formulation.
Argued writing and the reading habit.
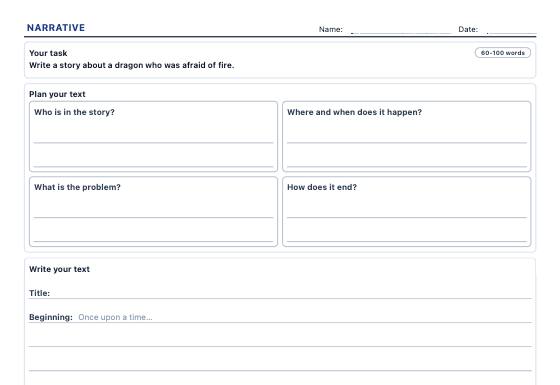
A4 writing frames for stories, descriptions, letters, news reports, opinion texts, instructions and emails: task, planning box, parts of the text, lines by age, a self-check list and a teacher guide with a rubric.
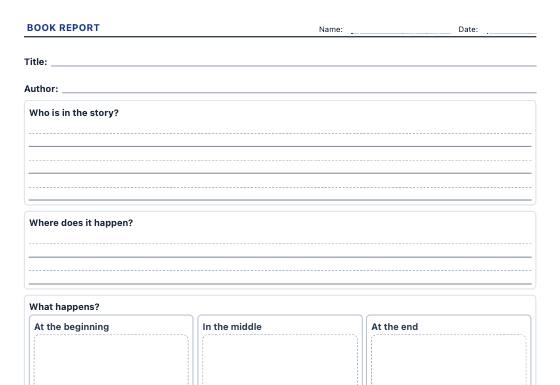
Create A4 sheets for any book: book report, character profile, story map, reading log and reading challenge passport, with line spacing and questions adapted to every stage.
Charts of real data and phenomena to explain.
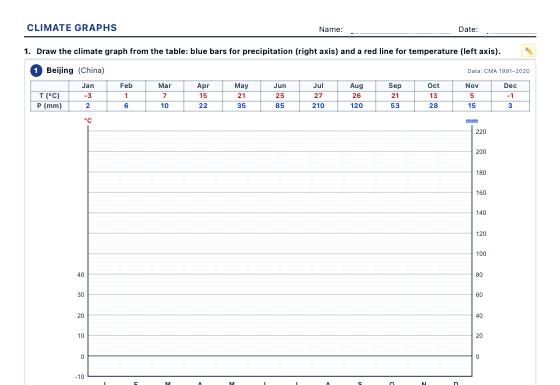
Climate graphs with real weather station data to draw, analyse (temperature range, mean temperature, dry months) and identify the climates of the world and of Spain, with an answer key.
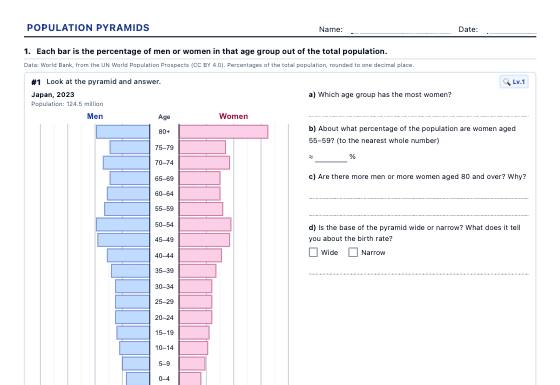
Population pyramids with real data from 40 countries (1960-2023) to read and classify, draw from a table, work out demographic indicators and compare, with an answer key.
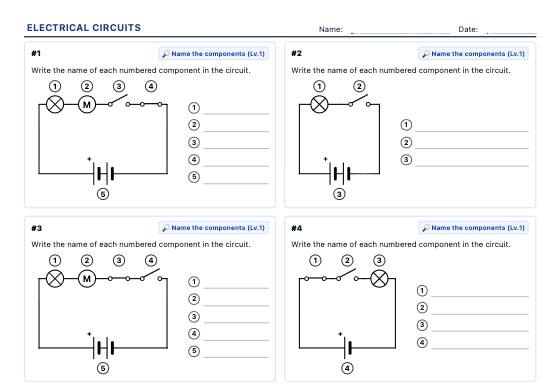
Always-new, properly solved circuits with standard symbols: name the components, predict which bulbs light up, tell series from parallel, draw diagrams and work through Ohm's law step by step.
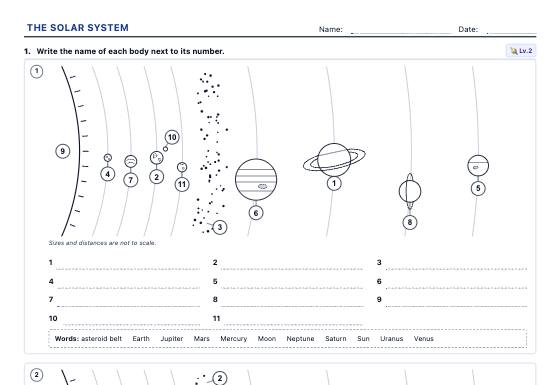
Worksheets to label and order the planets, answer questions from real NASA data and understand day and night, the seasons, the phases of the Moon and eclipses, with our own drawings and an answer key.
Algorithms and sequences, screen-free.
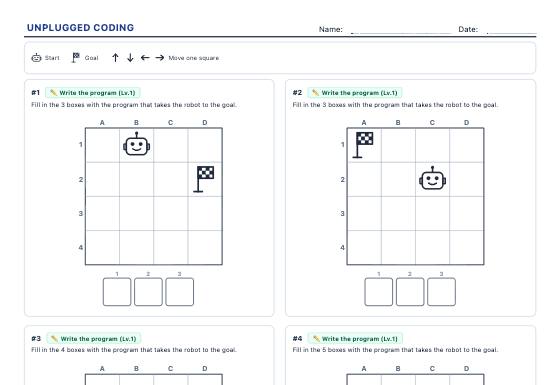
Screen-free coding challenges: write the arrow code that takes the robot to the goal, run a given program or find the bug, with loops at higher levels.
Points are lost in a competency test by not understanding what is asked, by not knowing how to set out an open answer, or by stopping at the calculation without going back to the context. All of that can be trained.
A long text with four questions, a yes/no table or an answer to justify no longer come as a surprise: their energy goes into thinking, not into decoding the test.
Each question works on a process: formulate, calculate and interpret in math; locate, understand and evaluate in reading; explain, design and interpret data in science.
Price lists, timetables, recipes, scale plans, climate graphs of real weather stations and population pyramids with World Bank data.
The guide gives full, partial or no credit and the model answer. Every answer is worked out from the printed values, so it never contradicts the sheet.
Each unit is generated afresh: they practise the competency, not memorise answers. Three levels per stage let them climb step by step.
Testing yourself to learn and spreading practice over time are the two study techniques rated highest in the review by Dunlosky and colleagues (2013). One unit a week is exactly that.
Read the study ↗Competencies are not crammed the week before: they are built grade by grade. Start with your child’s or your class’s grade.
Prices, recipes and timetables, simple charts and readings with several question types.
Grade 4 worksheets →Charts with data, percentages, scales, scientific enquiry and texts with several sources.
Grade 6 worksheets →Mid-level units, proportion, scientific investigation and evaluating opinion texts.
Grade 8 worksheets →The hardest units: misleading graphs, models, money and argument.
Grade 10 worksheets →They read the stimulus calmly, answer what they know first and justify their open answers. That calm is worth points too.
Create a PISA-style unitOne mock unit a week, taking turns with math, reading and science, and training worksheets in between.
Pick the generator and the level for their grade. In a minute you have the unit and its guide.
20 to 40 minutes, as in the test: read the whole stimulus first, then the questions.
With the marking guide, look at what got partial credit and why. During the week, reinforce that skill with its training worksheet.
The OECD’s Programme for International Student Assessment. It tests a sample of 15-year-olds in each country in mathematics, reading and science, and in some cycles also financial literacy, creative thinking or a foreign language. It does not measure what is memorised but whether it can be applied to real-life problems.
No. They are original units that follow the public format of PISA and of national competency tests: a stimulus, questions of rising difficulty in mixed formats and a marking guide. LearnKits is not affiliated with the OECD. The OECD publishes released PISA items if you want to see official ones.
From Grade 4. The PISA-style math problems generator has levels for Grades 4 to 6, 7 and 8, and 9 and 10, and the reading and science kits go from elementary to high school.
With the marking guide printed with the worksheet: it says which answer gets full, partial or no credit, with a model answer. In reading comprehension open questions come with their model answer too, and the scientific enquiry answer key gives the answer to every question.
Because what is assessed is reasoning: reading the stimulus, choosing the data and justifying the answer. On paper all the work shows and can be marked step by step. What paper cannot practise is interactive simulations; the rest of the format, it can.
Yes, every worksheet and its answers are free and no sign-up is needed. LearnKits Pro removes the ads and the watermark from the worksheets.
PISA is an OECD programme. LearnKits is not affiliated with the OECD; the units are original and follow its public format.
Choose the level, print the worksheet and its marking guide. Tomorrow, a different one.