Functions and Graphs Worksheet Generator

Example ready: change it or print it as it is.

Teacher guide ↓

Teaching guide: working with functions and graphs

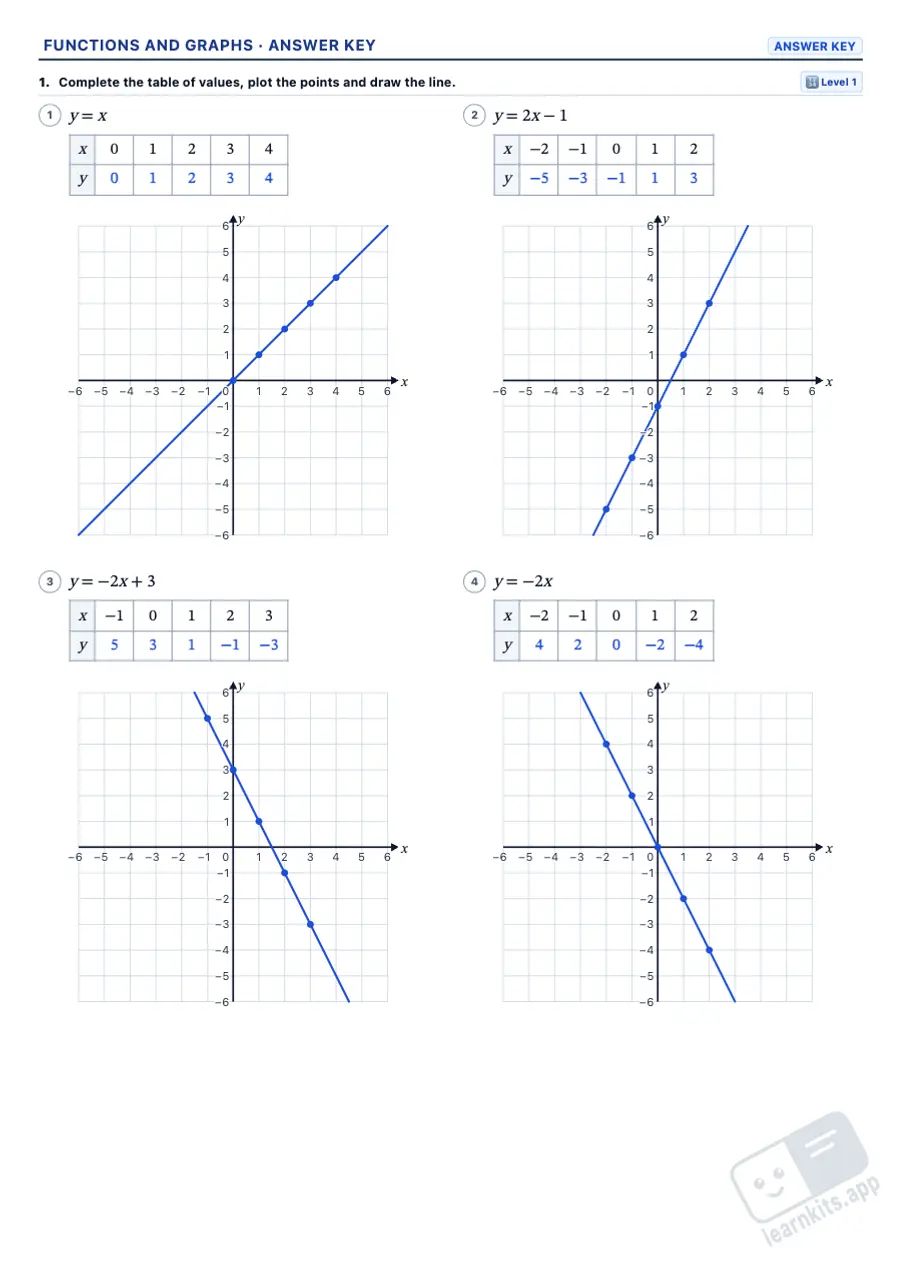
A function links every value of x to exactly one value of y, and its graph makes that link visible. This free functions and graphs worksheet generator builds A4 worksheets for Grades 8 to 10: tables of values, straight-line graphs, gradient and y-intercept, the line through two points, quadratic graphs, features of a graph and equations to match, with an answer key that draws the graphs.
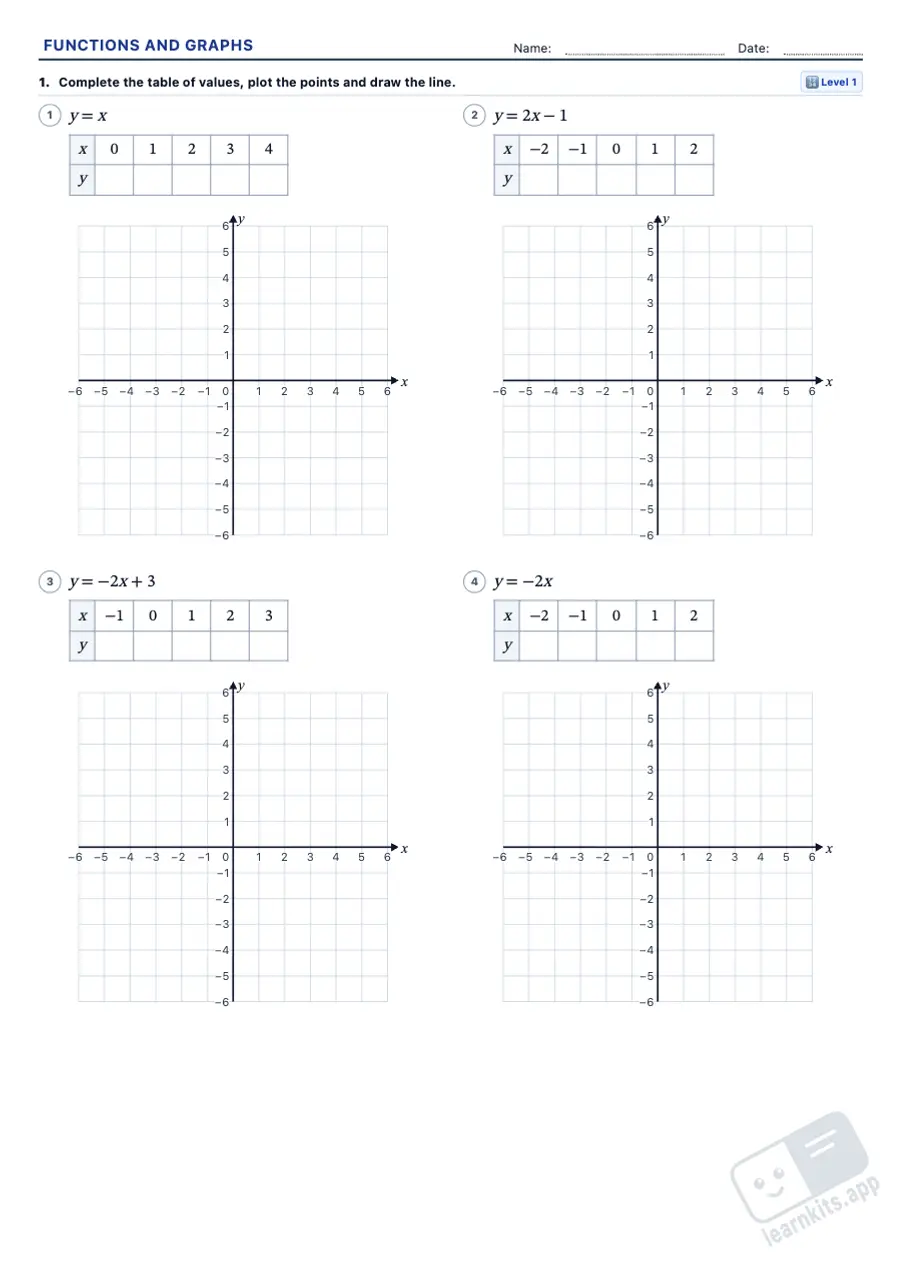
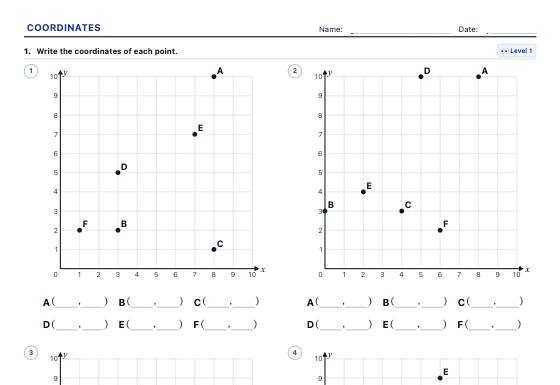
Functions and Graphs Worksheet Generator: sample printable A4 worksheet, first page of the student sheet Student worksheet
Functions and Graphs Worksheet Generator: sample answer key of the same worksheet, first page Answer key
Sample made with LearnKits. Every worksheet is new: choose the topic, level and amount and print it for free.

Tables of values

Substitute each x into the equation, plot the points and join them: if they line up it is a straight line; if they make a symmetrical curve, a parabola.

Gradient and y-intercept

In y = mx + c, m tells how far the line goes up for each square across and c where it crosses the y-axis. A positive gradient goes up; a negative one goes down.

From the graph to the equation

Find two grid points on the line: the gradient is the change in y divided by the change in x.

The line through two points

m = (y₂ − y₁)/(x₂ − x₁), then c = y₁ − m·x₁. Parallel lines have the same gradient.

Quadratic graphs

The sign of a tells which way the parabola opens, the turning point is at x = −b/2a and the x-intercepts are the solutions of ax² + bx + c = 0.

Reading a graph

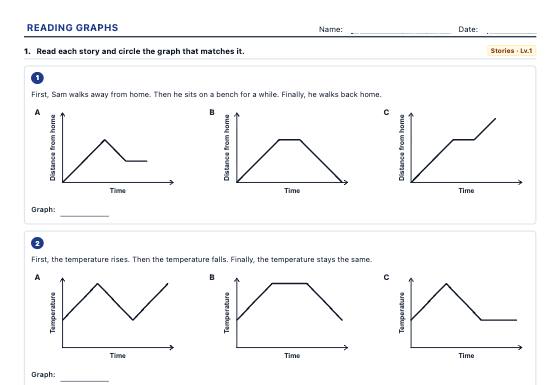
Domain, range, where the graph increases or decreases, turning points, intercepts and sign, always on grid points.
Frequently asked questions about functions worksheets

Which grades are these worksheets for?
Grades 8 to 10 (Year 9 to Year 11). Tables of values for straight lines, y = mx + c, domain and range, and matching straight lines suit Grade 8; fractional gradients, the line through two points, the first quadratic graphs and increasing intervals Grade 9; the general form, parallel lines, y = ax² + bx + c and the sign of a function Grade 10.
Can pupils read the graphs accurately?
Yes. Every graph passes through grid points wherever pupils must read a value: the turning point and intercepts of a parabola, the corners of a graph and where it crosses the axes. When the y-intercept is a fraction, two grid points are marked on the line.
Are the answers exact?
Yes. Every number is a whole number or an exact fraction, never a rounded decimal, and every answer is worked out from the printed equation or the plotted points. When matching equations to graphs, the four functions are different and at least one square apart at a grid point, so there is only one correct way to match them.
What is in the answer key?
The completed tables with the graph drawn, the gradient, intercept and equation of each line, the working for the line through two points, the turning point, line of symmetry and intercepts of each parabola marked on the graph, the intervals and turning points written in, and the correct options circled.
How are intervals written?
As inequalities, as in GCSE: the domain −5 ≤ x ≤ 3, the range −2 ≤ y ≤ 4, and the graph increasing for −2 < x < 1. The Spanish and Catalan pages use interval notation, [−5, 3] and (−2, 1).
What other worksheets go well with functions?
The coordinate plane to start with, linear equations, simultaneous equations (graphical method), quadratic equations for where a parabola crosses the x-axis, proportion and real-life graphs. Find every resource under maths worksheets.
How do I print only the answer key?
Click Print and choose "Answer key", or "Worksheet and answer key" for both. Your browser's print dialog can also save it as a PDF.
Is any pupil data sent anywhere?
No. Worksheets are generated in your browser and templates are saved in your browser's memory.